
04.06.2024
Development of a digital product concept
How can future technologies be designed for the users and the market of today and tomorrow? In the research project “DR. BEAT” (Digital Research on Ballistocardiography for Extraterrestrial And Terrestrial Use), we are combining space technology with medical technology and developing a product idea from the user journey to implementation.
Initial situation
According to the Federal Statistical Office, diseases of the circulatory system caused the highest medical costs in 2020 at 56.7 billion euros. The systems currently available for monitoring cardiac function only offer limited options for monitoring patients at risk, are comparatively expensive or can only be used on an inpatient basis. “DR. BEAT” therefore relies on ballistocardiography (BCG) technology to apply it to the diagnosis of heart disease and to detect cardiological abnormalities better and faster in everyday life.
Together with our partners DSI Aerospace Technologie GmbH in Bremen and the Peter L. Reichertz Institute for Medical Informatics in Hanover, we were able to bring together all the expertise required for the project:
Excursus: What is ballistocardiography?
Ballistocardiography (BCG) uses modern, digital microelectronics to record various heart functions.
BCG measures vibrations that are generated by the movement of the heart and transmitted to the surface of the body. The measured BCG signal represents the pulse wave that travels through the body’s blood vessels with each heartbeat, making it possible to determine the heart rate, for example
BCG has also been used successfully in space travel, as the monitoring of central bodily functions has always played a major role in this context. Astronauts are subject to high physical stress in weightlessness and have no opportunity to have complaints examined in a medical practice.
Aim of the project
The aim of the project was to develop a high-precision and cost-effective BCG sensor system that can be worn on the body as a small, compact “wearable” and enables continuous health monitoring. In contrast to cabling with an ECG, it does not restrict the patient during the wearing period.
The extensive signal processing, data evaluation and visualization is automated using artificial intelligence (AI) and should not only provide new insights into space medicine, but also enable dynamic cardiac activity to be recorded in a way that is suitable for everyday use.
In the course of the research project, interviews with healthcare professionals revealed great potential for the use of the sensor in the diagnosis of heart failure. Based on this, UID developed a product scenario with the following measures:
- Development of possible areas of application for the sensor, taking into account medical potential and technical conditions
- Development of a digital product concept for BCG technology using appropriate UX methodologies
- Coordination of the user-centered design process in accordance with DIN EN 9241-210 and the integration of end users’ needs into the product concept
- Implementation of the user interface
- Holistic advice from innovation and UX experts from brainstorming to implementation
In the following, we present our project approach in detail.
-
Brainstorming
Brainstorming
From a medical perspective, the sensor has great potential to diagnose heart failure (in a time frame of up to 24 hours). The diagnosis of atrial fibrillation would also be possible, but the sensor would probably have to be worn for longer than a week. Due to limited battery life, this recording period cannot currently be realized. For this reason, the clinical picture of heart failure was pursued further and the user journey was adapted accordingly. Based on the findings from the interviews, we developed two personas as a narrative model to gain a better understanding of the user groups. And finalized the user journey as a basis for further product concept development.
Example user journey
A patient is often tired, quickly becomes short of breath and has “water in his legs”. He makes an appointment with the doctor. After a general medical history, blood pressure measurement and a physical examination, the doctor decides to stick the Dr. Beat Sensor on the patient.
Blood is taken from the patient and a follow-up appointment is arranged a week later. On the way home, the patient experiences shortness of breath again. After a 24-hour measurement, the patient removes the sensor as instructed by the doctor and stores it safely. At the follow-up appointment, the patient brings the sensor with them and hands it in at the registration desk. The receptionist transfers the data to the patient file. The doctor reviews the data and discusses it with the patient. Diagnosis: heart failure NYHA II. The doctor recommends a therapy and then documents the session.
2. Validate future concepts
Does the product idea meet economic and social trends? We held a futures thinking workshop with the project stakeholders to find and define factors that will have the greatest influence on the success of the sensor in the future.

3. UX design with user testing
We then developed suitable visualization concepts in accordance with DIN EN ISO 9241-210 with the clear objective of creating a clear and intuitively understandable user interface that helps medical staff to quickly derive diagnoses from the heart parameters. The concept and design were developed iteratively. The UI designs were reviewed and improved after each phase through user tests with doctors.

UI concept
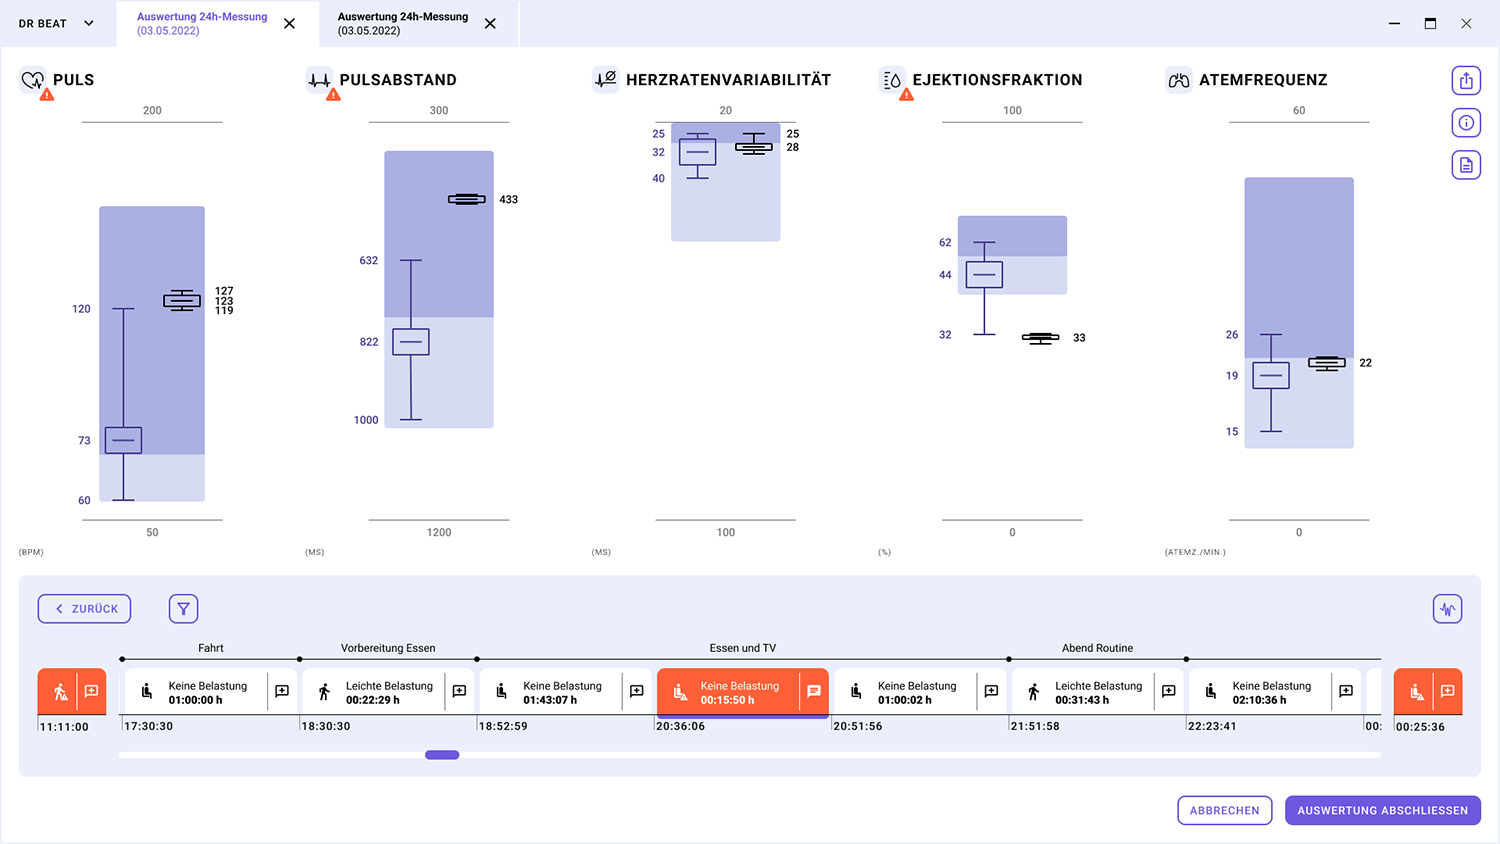
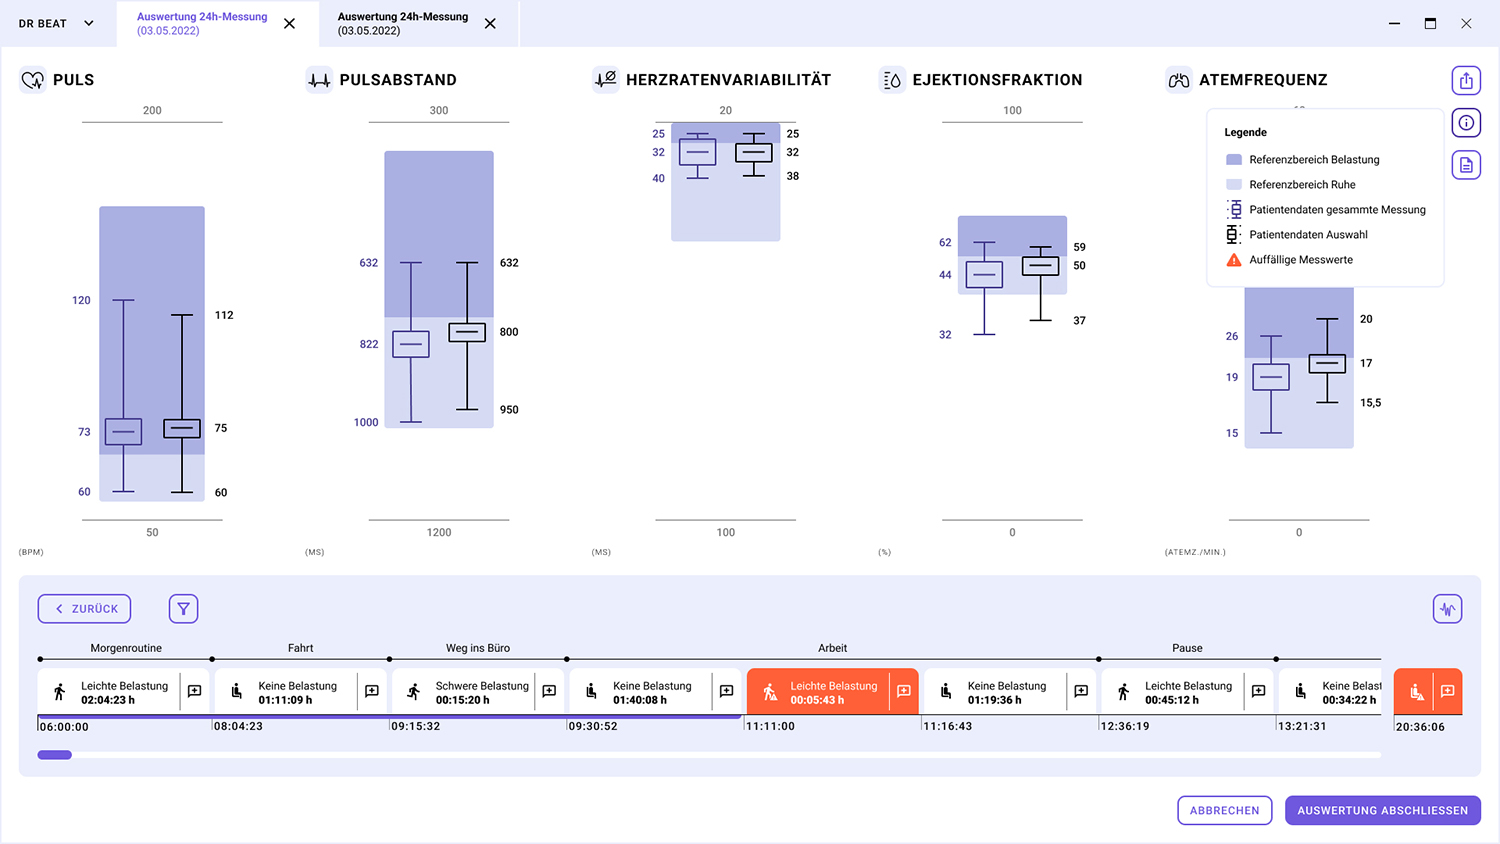
The information visualization includes the display of 5 cardiac parameters incl. time axis and display of the type of stress, the marking of conspicuous measurements as well as easy access to more in-depth details such as raw data and the possibility for doctors and patients to add comments to the measurement.
Challenges:
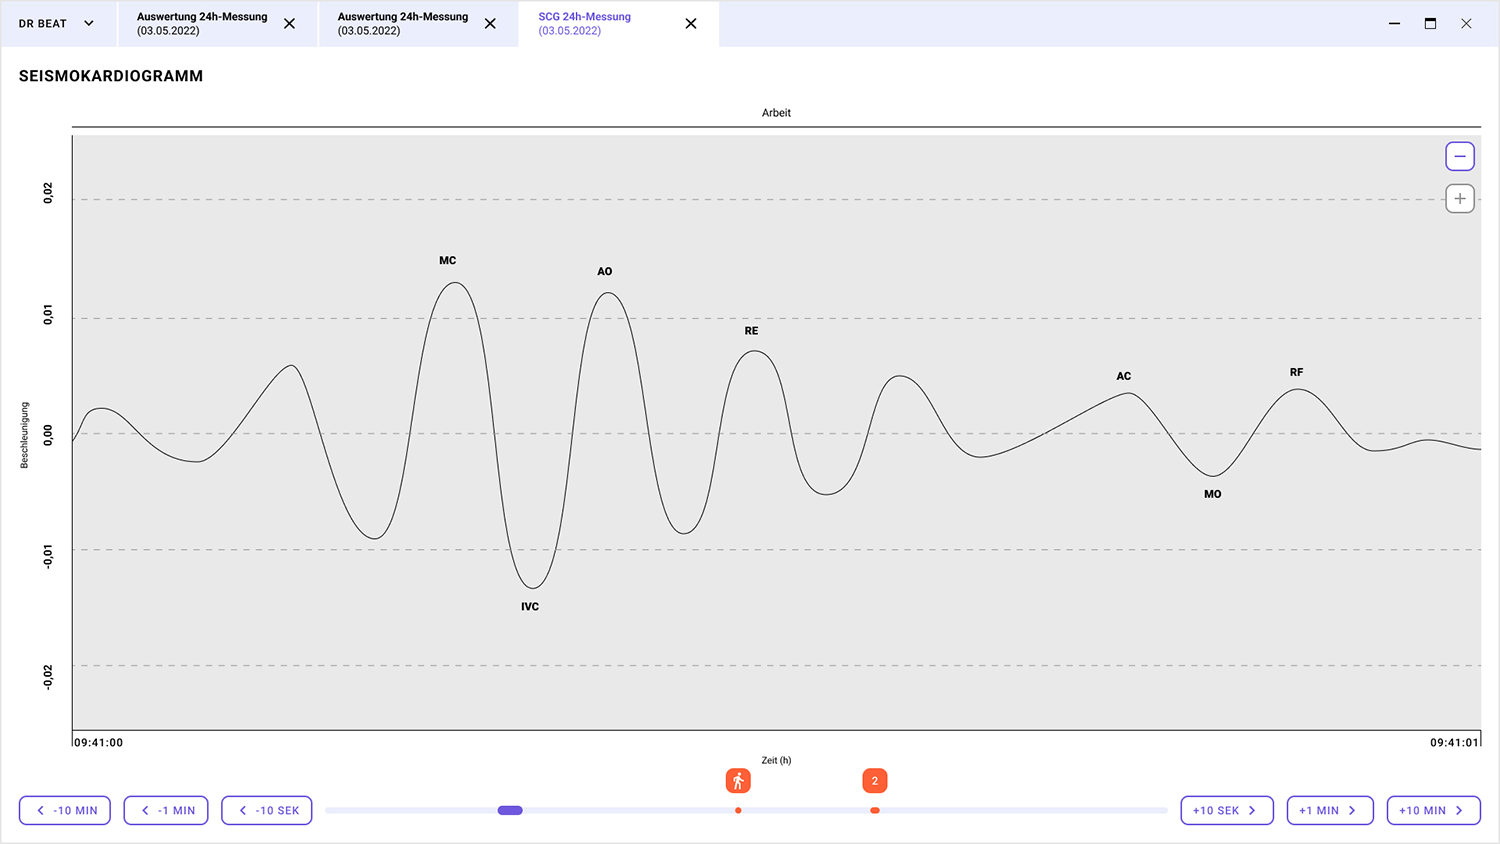
- The concept of the time axis, which covers a period of 24 hours and at the same time is intended to highlight anomalies in the seconds range
- Restrictions in the color world due to the medical context and accessibility (test subjects with red-green ametropia)
- Navigation between different measurements of a patient
Based on the information from our project partners, we first developed an initial draft concept for the information visualization. User tests were carried out with six doctors to gather user feedback.
They also recorded how patients with heart problems and diseases have been dealt with to date and what experiences they have had with “competing” technologies such as ECGs. In the test tasks, the participants were given a scenario that they had to use to operate the UI. They were asked to think aloud and express any positive or negative criticism that came to mind when operating the UI. The scenario can be used to ensure that feedback is obtained from all components.

The findings from the user feedback were incorporated into the concept. Examples of concept-relevant findings:
- The interviews showed that even anomalies of a few seconds are relevant
- According to the participants, the measured values of the various cardiac parameters are particularly important.
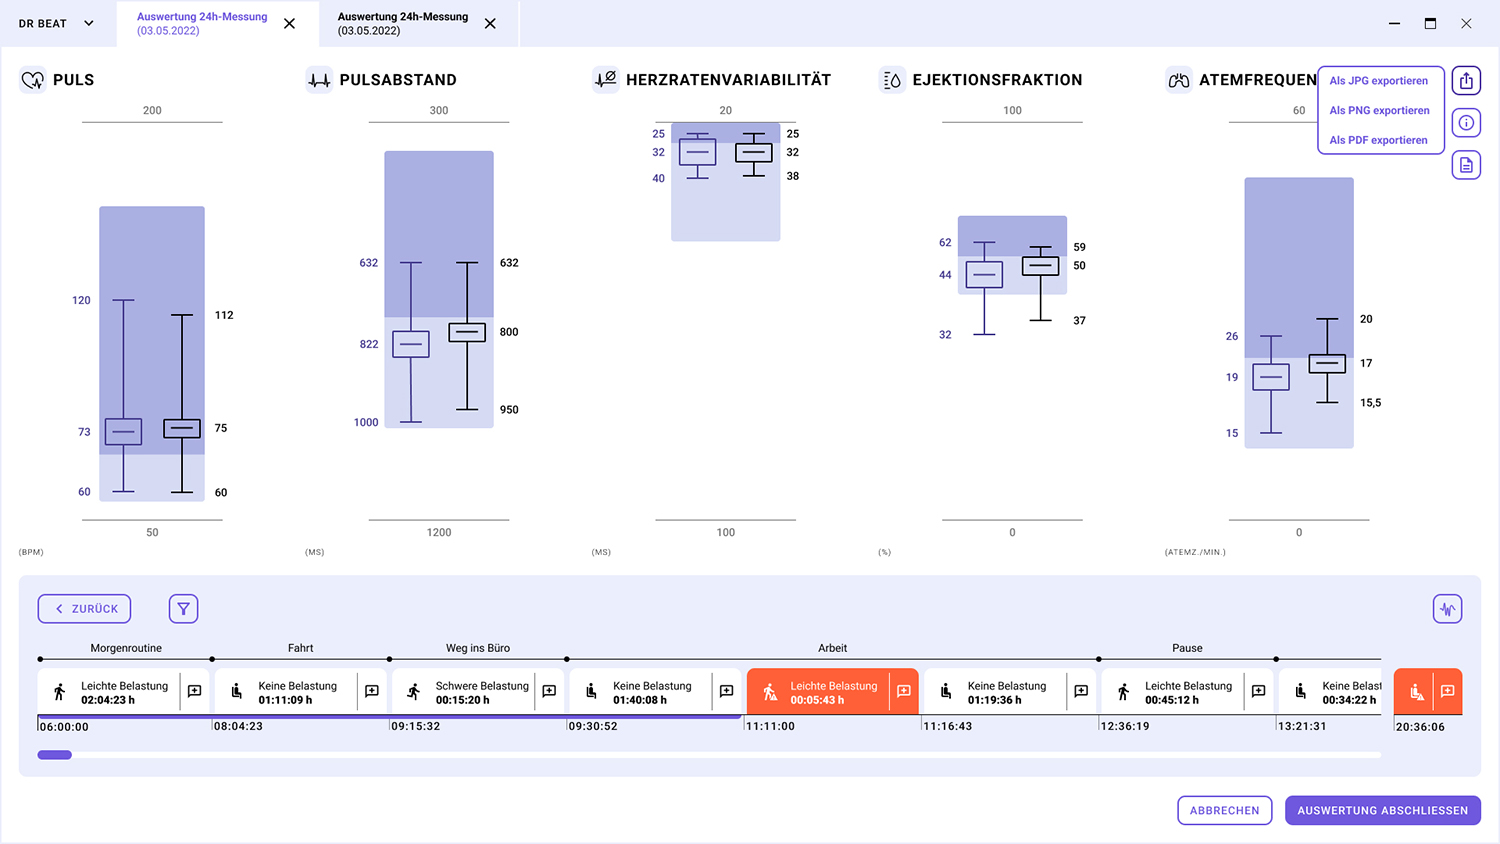
For this reason, the boxplot area was increased to two thirds of the total surface area. - The user tests showed that the raw data is only required in exceptional cases and does not need to be visible on the main screen.
The information was made available in the concept accordingly via a separate dialog - Additional functions were added to the concept at the request of the participants.
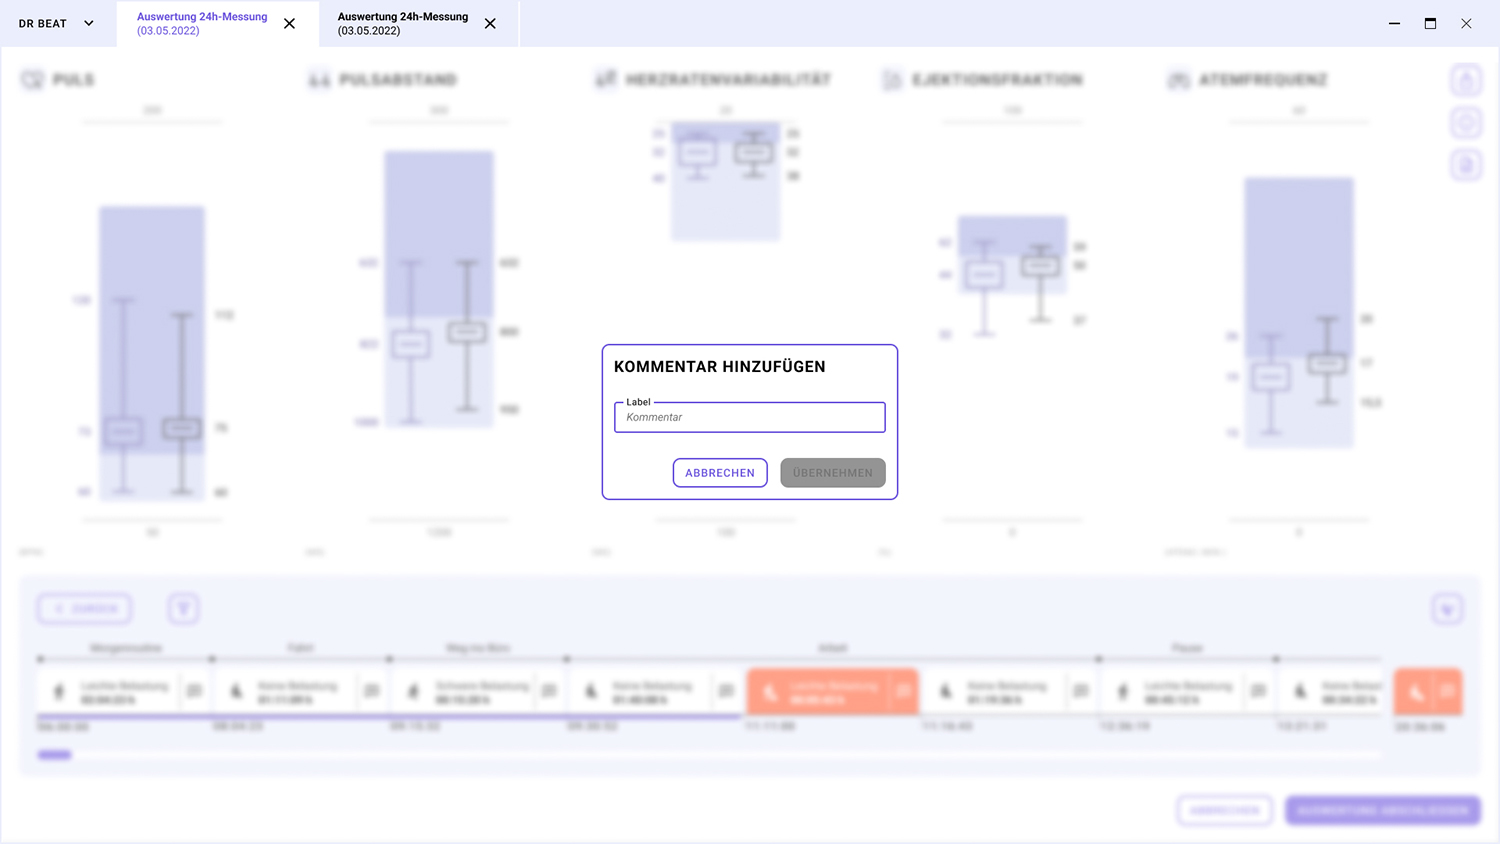
These include an export function that exports the current view of the boxplots and time axis. - Participants expressed concern about further unsettling uncertain patients with the evaluation, as no diagnosis can be made at this point.
The point of uncertainty should be taken into account in the UI design.
Following the user tests, a UI design was developed in which the next concept was to be implemented so that it could be queried together with the concept in the next user test.
UI Design
The style development of the UI design can be roughly divided into three phases: Benchmark, moodboard creation and its transfer into a design (design style development).
Mood boards are visual representations that convey a certain mood, concept or creative direction of a product. As part of the research project, we created various mood boards based on different values and derived the subsequent design style from them.
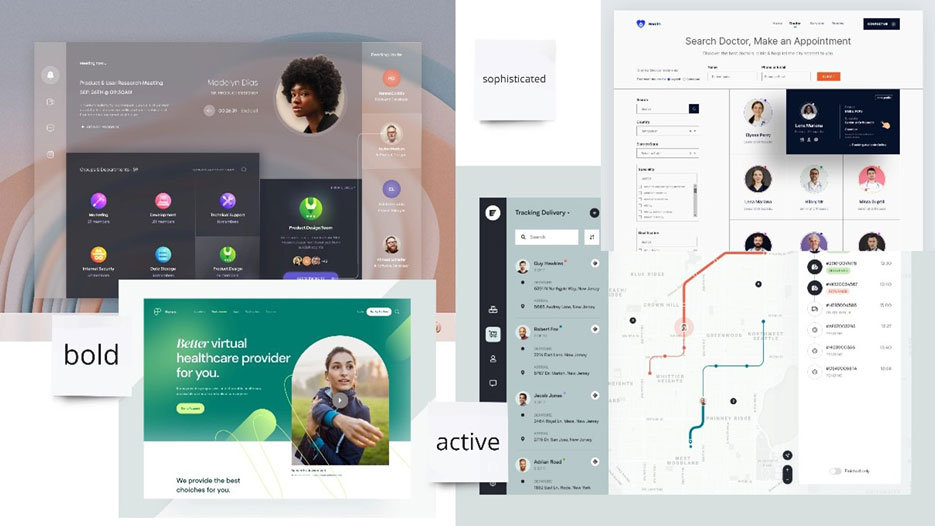
Moodboard variant 1
Moodboard version 1 is based on light-dark contrasts and saturated accent colors.
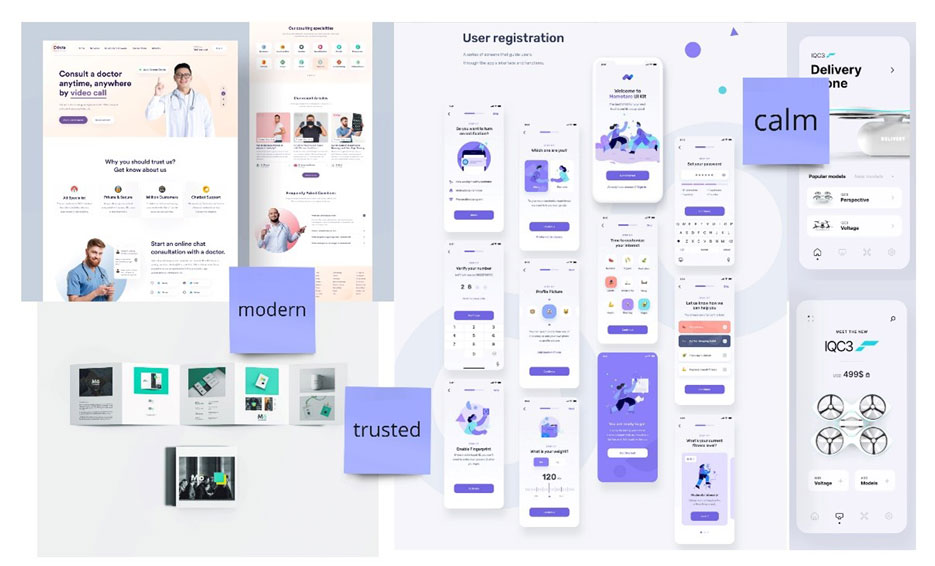
Moodboard variant 2
Moodboard version 2 also has a saturated accent color, but all other colors are in a more neutral color space.
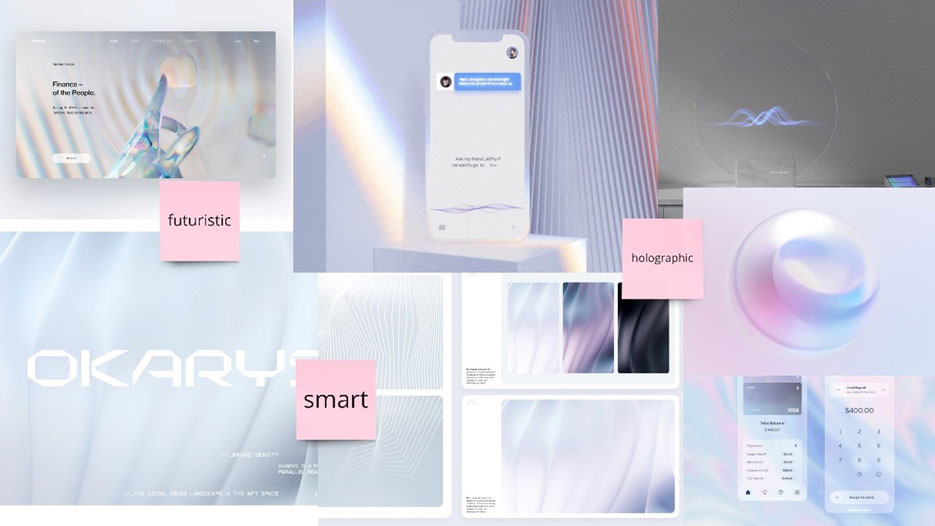
Moodboard variant 3
Moodboard version 3 works a lot with two-dimensional texture and a wide range of colors.
Visualization challenges
There were also various challenges to consider for the UI design:
Data visualization
The design should contribute to the clarity of the data visualization and at the same time appear modern, trustworthy and reassuring so as not to cause anxiety among patients when discussing the results.
Color selection
When determining the colors, it was important to take into account the color coding that applies in the medical context. We chose purple as the accent color. The accent color purple symbolizes all interactive elements. To create a harmonious overall picture, the colors in the background are based on the accent color.
Accessibility
In order to comply with the relevant accessibility guidelines in this context, the colors were checked for sufficient contrast. In addition, color vision filters were used to ensure that the colors are still sufficiently different from each other. Care was also taken to ensure that information about color, text and icons was coded at least twice. Nevertheless, the tests repeatedly revealed problems and once again underlined the need for user tests with those affected.
Excursus: Selecting the accent color
In a medical context, red is used to indicate an immediately life-threatening situation for the patient.
Yellow stands for all other dangers for the patient and blue for system messages. In the design context, the color red indicates all error messages, yellow all warnings and blue also system messages. Green is also used for positive system feedback. Therefore, only purple, pink, orange and cyan could be used as accent colors. Pink is often associated with femininity, which is why this color was also excluded. Cyan looks very technical and is already used in many other health and sensor apps. Purple was chosen as an accent color to stand out from the crowd. Orange also lent itself as a warning color for conspicuous measurements.
4. Prototyping
A prototype was created to re-evaluate the revised concept. This was created with the help of Figma and not implemented with code. The design tool can be used to simulate a sufficiently realistic interaction.
However, the time required is considerably less, which means that costs can be saved.
Five user tests were carried out with doctors for the second evaluation. Some of the participants had already taken part in the first user test. This made it possible to check whether the wishes and needs from the first user tests had now been implemented appropriately.
After evaluating the interviews, the findings were integrated into the concept and design in a further iteration loop.
Click through the final concept:
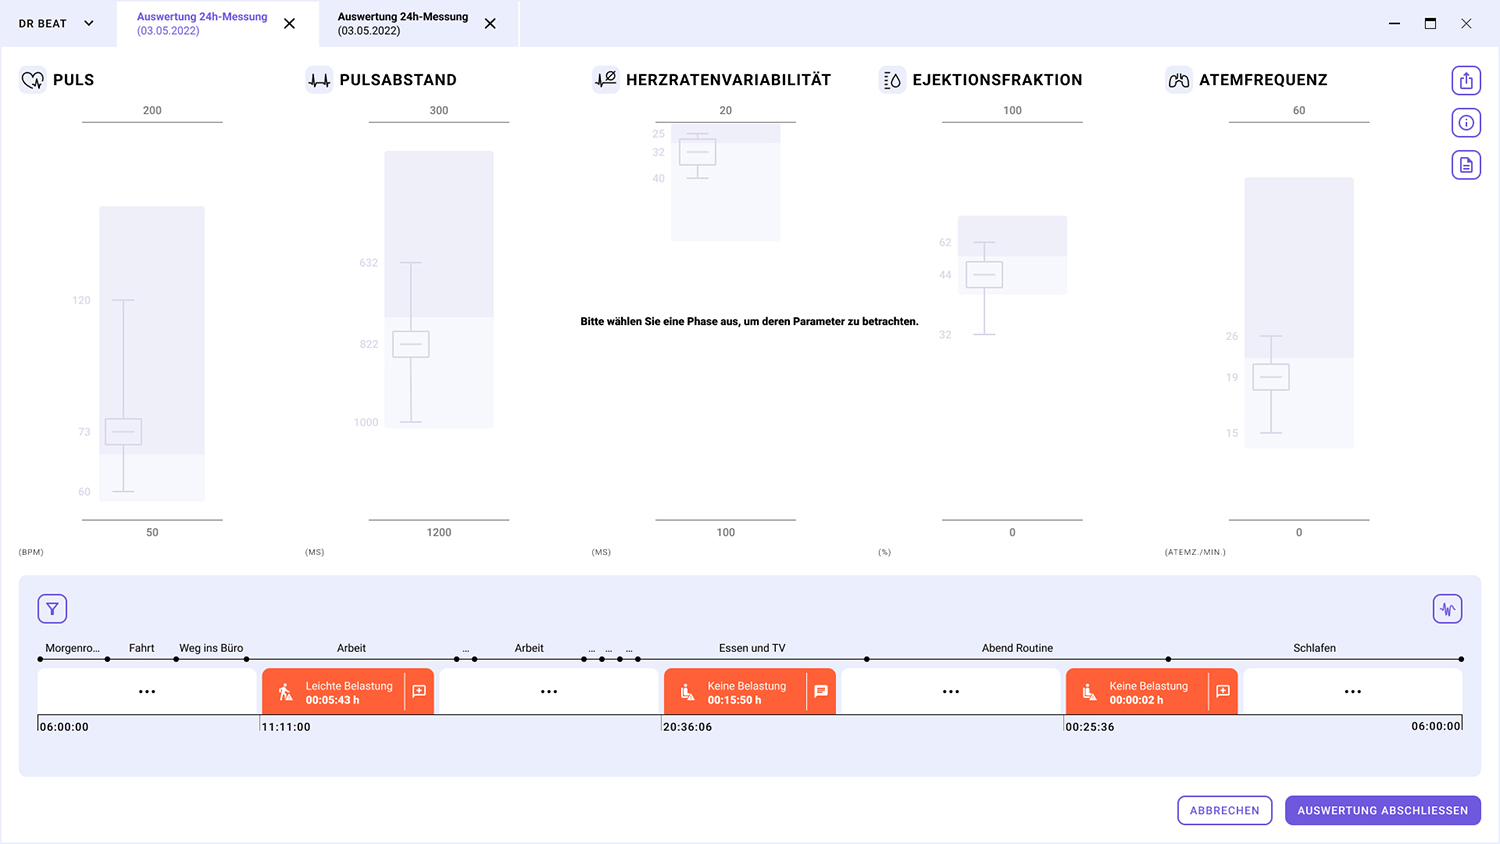
Final concept
View after opening the measurement
Final concept
View after clicking on an anomaly
Final concept
Possibility to add comment by physician
Final concept
Possibility to export content
Final concept
Ärzt:in can filter Timeline according to a specific type of stress.
Final concept
Zoom to raw data (1 second)
Final concept
View with expanded legend
5. Front-end development with custom UI controls
The next step was to develop the user interface. This uses various web technologies to provide an efficient and user-friendly solution for visualizing the sensor data.
- Creation of UI building blocks and web components in Atomic Design: The UI building blocks (controls) were implemented as web components, including standard controls such as buttons as well as complex, user-defined (custom) controls.
Web Components allow to create reusable, encapsulated and interoperable HTML tags for websites and web apps that work in all browsers and integrate with other frameworks (e.g. Angular, React, Vue.js…) and libraries.
In line with Brad Frost’s Atomic Design model, the web components in this project were divided into three main categories: Atoms, Molecules and Organisms.
- Development of an Angular application: An Angular app was created using the UI building blocks.
Angular is a widely used open source web application framework developed by Google.
It enables the development of dynamic, interactive web applications through the use of TypeScript and HTML, and helps organize the structure and functionality of the app, including data binding, component architecture, routing and form management.
The decision to use web components with Stencil, the creation of a storybook for the independent development of (especially the custom) UI controls, and the choice of Angular as the application framework have enabled a robust, testable and maintainable solution. The clear separation of responsibilities and the modularity of the project promote efficient development and maintenance. The use of modern tools and web technologies such as Stencil and Angular ensures that the project complies with current best practices and is well positioned for future requirements.
The use of the Atomic Design Model was a key element in the development of Web Components. The structured division into atoms, molecules and organisms enabled the project to create coherent, reusable and easily maintainable UI elements. The combination of this methodology with the strategic use of frameworks such as Stencil, Angular and D3.js as well as tools such as Storybook has contributed significantly to the realization of a robust and future-proof application and the chosen architecture helps to implement changes to the data model without changing the UI and changes in the UI without changing the data model, which is a stable basis for future development.
Conclusion
The project will not only present concrete results, but also highlight the remaining technology gaps and new areas of research in data analysis and diagnostics. If the quality of the measurements allows, future research projects and collaborations with other industrial partners (e.g. medical device manufacturers) could tackle challenges such as further development into a medical device. Overall, there is great interest in a BCG-based solution for monitoring cardiovascular parameters, which has a high utilization potential in both terrestrial and extraterrestrial applications.